
Hands-On Example: Defining Submodels
Modeling projects in Valsight often faces the challenge of decomposing a complex logic into the right submodels for the specific usecase. In this article, we share an example and walk through the considerations of the structure and associated dimensionality.
In general, before defining the submodel strucutre, you should have a clear idea who is going to use the model and the overall usecase. A model that is only used for simulation by a single person is easier to structure than a model that is suitable for a multi-user planning process.
In this article, we will outline the model structure for a model that is suitable for multi-user usage.
Proposed Submodel Structure
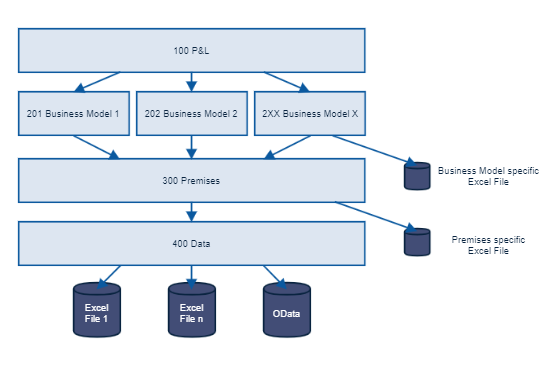
The proposed submodel structure - Arrows indicate the "has submodel" relationship, hence they define data access and not data flow (data flow = opposite directection of arrows)
Let's work through this from bottom to top, starting with the data sources.
Our recommendation is to connect data sources to only one model, as it makes the management and updating much easier in the long run. Data sources can even be configured to be attached to one model, which enforces that they are not used anywhere else.
The 400 Data model now simply "pulls the data in". All information that is used should be connected to a single node in the model. Typically you do simple data cleaning tasks such as mulitply with -1 or 1000 in this model layer. The data model often contains just a few not connected nodes. This will make it easier in the long run to understand which data is used where. In an ideal world, the "400 Data" model only contains actual (or factual) data, such as the last actuals, or - if you want to use a Forecast or Plan as basis for the simulation - then this. The important distinction between all other models is, that the "400 Data" model should not contain any datapoints in the future, it mearly defines the basis for the simulation.
The 300 Premises model is the first where we may see data about the future. It contains nodes that are used as drivers in all other models, such as an inflation rate. Here it is important, that all data is only brought into the simulation through assumptions in the scenario manager. You may, however, work with multiple data scenarios to include testdata, for meaningful data previews. With the example of our inflation: You would enter a 0% inflation in the data scenario and onlyset it to 2% in the scenario manager. You can, however, add a second data scenario, where you enter the 2% directly so that simulation on the data scenario produce meaningful output in the data preview. To facitlitate the planning process later on, each node in the premises model should have at least the "business model dimension" which basically is the Org or Business model dimension by which the 200 - Layer is split up.
The 20X Models use base data from the 400 and 300 models to define business model specific logic. They typically define how base data (no info about future) and premises (info about future) are combined to create a simulated outcome. Additional drivers that are only relevant for this business model can be modeled here. It is advisable to retain the Org dimension in this model, as it eases the combination in the next layer. Alternativly the data can be pulled into the next layer with the expand single functionality.
The 100 P&L model defines the entry point for our workspaces. It creates a combined view to allow us to access all data. Depending on your specific needs, this model can be either empty, or very simple, e.g. just combining revenues and costs from all different submodels.
The names and numbers used are not mandatory and only used to make the models a) sortable and b) clearer which models are on the same layer. You may add additional layers if it helps to structure your usecase. Many prefer, for example, to use multiple models in the premises layer to differentiate between different drivers.
Summary - Submodels
Model Layer | Purpose | Timeframe | Dimensionality (minmal) |
|---|---|---|---|
100 P&L | Combination of all specific business modells | Simulation Horizon | Time, Org, others |
20x Business Models | Define Specific business logic | Simulation Horizon | Time, Org, others |
300 Premises | Define Placeholders for generic drivers | Simulation Horizon | Time, Org, others |
400 Data | Pull Data into the model | Base Year | Time |
Recommendations for interfaces between models, based on examples
Model Layer | Dimensionality (min) | Dimensionality typical Usecase | Example | ||
|---|---|---|---|---|---|
100 P&L | Time, Org | ||||
Interface | Revenue | Cost | Time, Org | Revenue [ 2018, Business Unit A, 50 ; 2019, Business Unit A, 55 ; 2020, Business Unit A, 60 ; ....] | |
20x Business Models | Time, Org, Business Model specific Dimensions, for example | ||||
Interface | Inflation | Market Growth | Time, Org | Inflation [ 2018, Business Unit A, 0 ; 2019, Business Unit A, 0 ; 2020, Business Unit A, 0 ; ....] | |
300 Premises | Time, Org and Dimensions valid for all Business Models, such as Countries | ||||
Interface | Revenue (Base) | Sold Volume (Base) | Time, Org | Revenue [ 2018, Business Unit A, Product X, 100] | |
400 Data | Time, Org, Technical Dimensions to select/filter/clean data | ||||
Data Layer | Excel Files | Databases | Usually time and Org |
We include the Org level in each data layer, because it eases the implementation of data permission on this dimension later on
Implementing the Planning Process with Workspaces and Scenario Sharing
Adding data about upcoming projects and assumptions is done in the Workspace layer. Following the submodel structure from above, we define a workspace for the premises, one for each planning entity and one for the P&L view. The following table shows the association to the models
Model Layer | Workspace | Access |
|---|---|---|
100 P&L | 100 P&L | Core users |
20X | One Workspace for each model, or multiple per model. If you, for example, have only one model for the product business, but still have multiple entities that enter planning data for products, you can create multiple workspaces per model. Access can be differentiated with workspace filters & data permissions. | Planning Users |
300 Premises | 300 Premises, one workspace to enter assumptions about premises. | Core users |
Process Time | (1) Start of Planning Process | (2) Kickoff Data Entry in Planning Entities | (3) "Doing" of Data Entry, Parallel in the organization. | (4) Start of Consolidation Phase | (5) Discussions |
|---|---|---|---|---|---|
Process Step | Defining Premises and Targets | Handover | Planning Entities | Handover | Consolidate Scenarios |
Users | Core user for planning process | Core user for planning process | Each Planning User | (1) Each Planning User, (2) Core user for planning process | Core user for planning process |
Tasks |
|
|
|
|
|