Filters in Valsight
Basic Overview
Setting filters can be done at multiple places within Valsight (Workspace, Sheet, Perspectives, Charts)
The filter management dialog employs the same behavior and functions in all places it is used at
Two available select modes help you as a user to work flexibly while setting or removing filters
Workspace Filter
A workspace filter are the highest level of filter to be set.
Workspace filters help you organize your workspace and allow quick and easy access to specific information contained within workspaces and worksheets.
They are filters that apply to an entire workspace, including all worksheets belonging to a workspace and consequently all charts positioned within these worksheets.
By applying workspace filters, you can choose which dimensions and levels should be included in your visualizations. This way, you can filter out specific dimensions, levels, or time periods to quickly adapt your charts and tables.
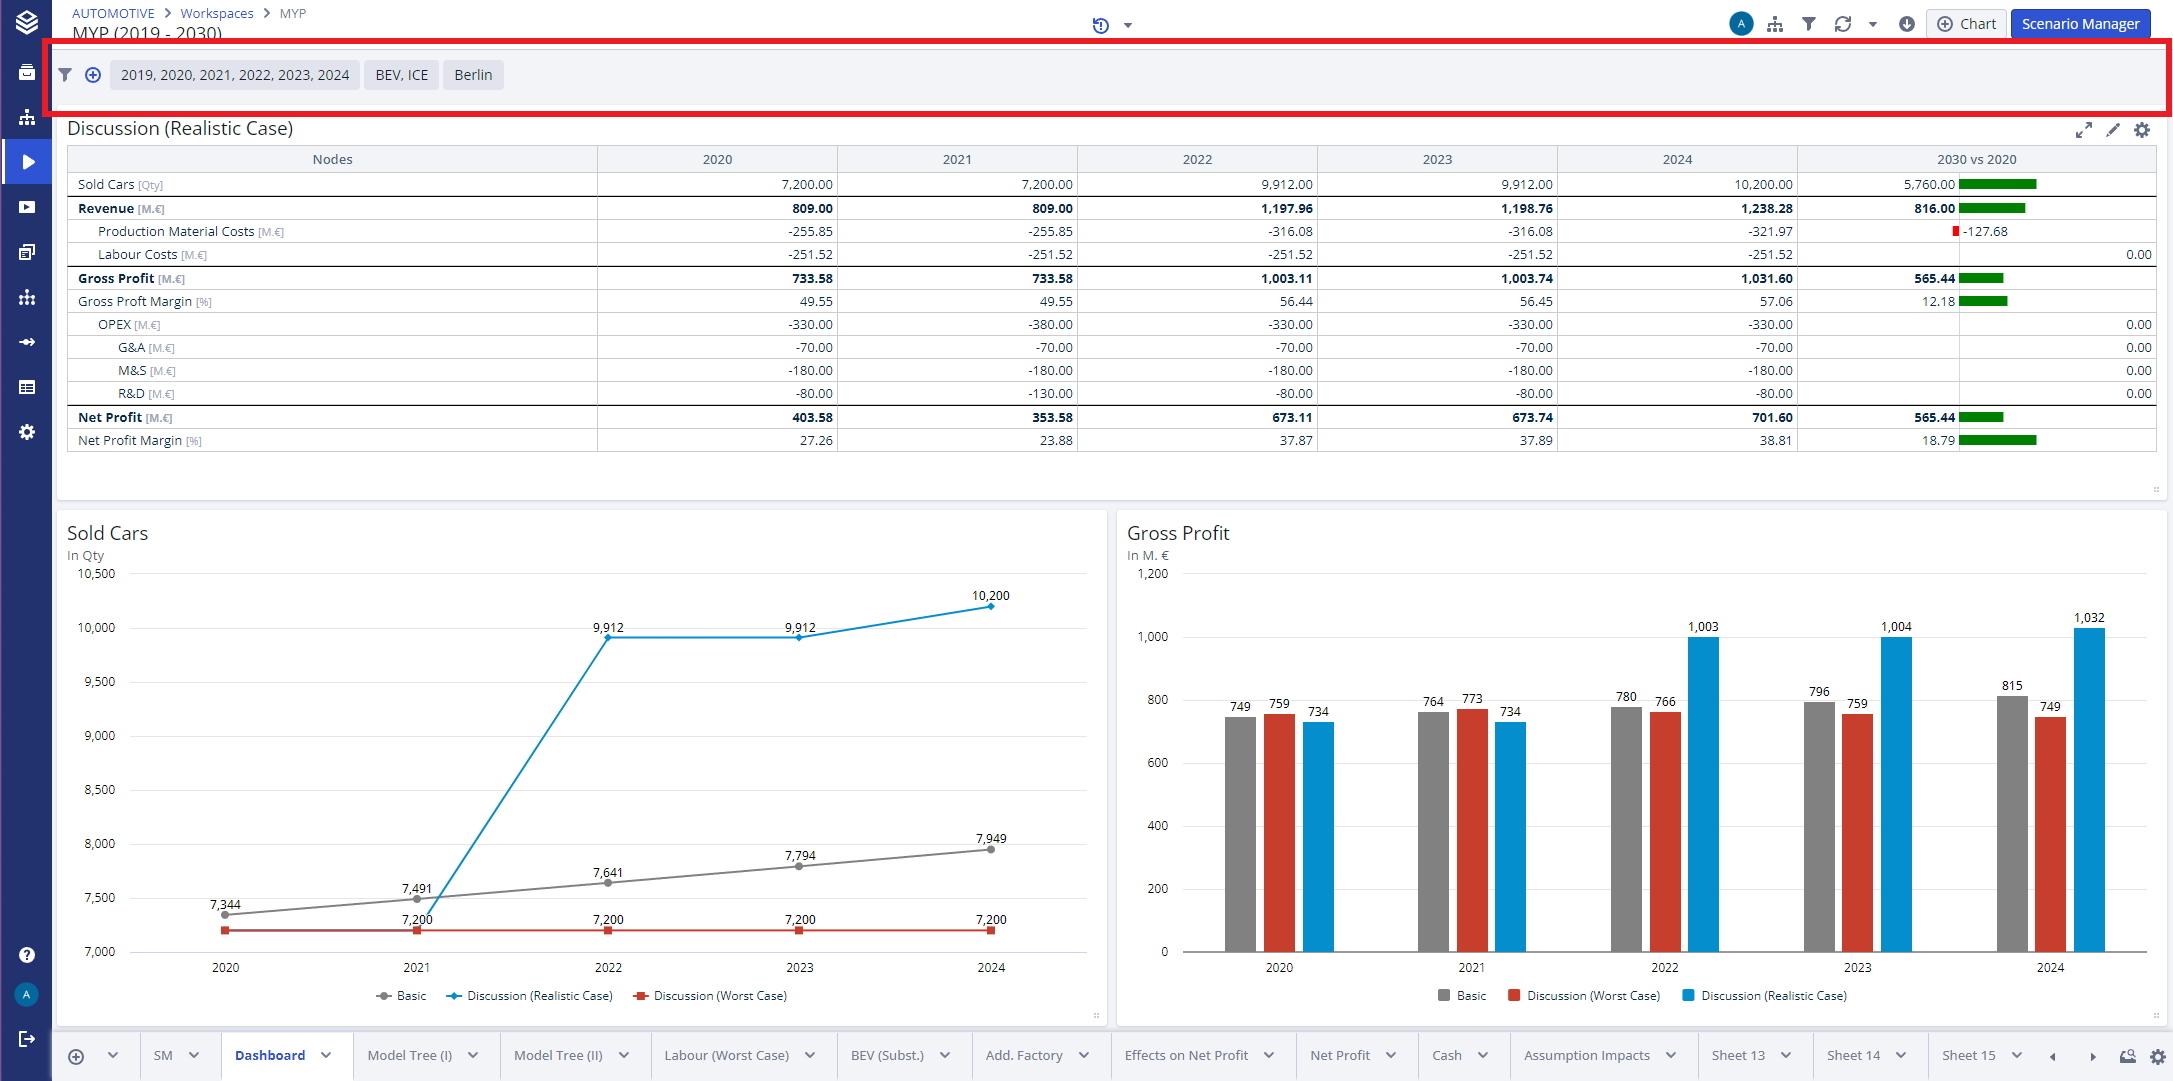
To apply workspace filters, click on the funnel icon in the header bar and select “Add filter”. You can then assemble a filter by choosing the conditions you want to filter for.
Filters can be set to include or exclude only values that comply or do not comply with a specific condition. This way, you can filter your data either in- or exclusively.
Worksheet Filter
Worksheet filters are the second level of filter available in Valsight.
Worksheet filters allow users to easily and quickly adjust the focus of a worksheet.
Workspace filters affect all set chart filters which allows a quick change of focus of a sheet without the need to change all chart filters manually.
To apply or edit worksheet filters, open the options of the selected sheets and either hide or show the worksheet filters.
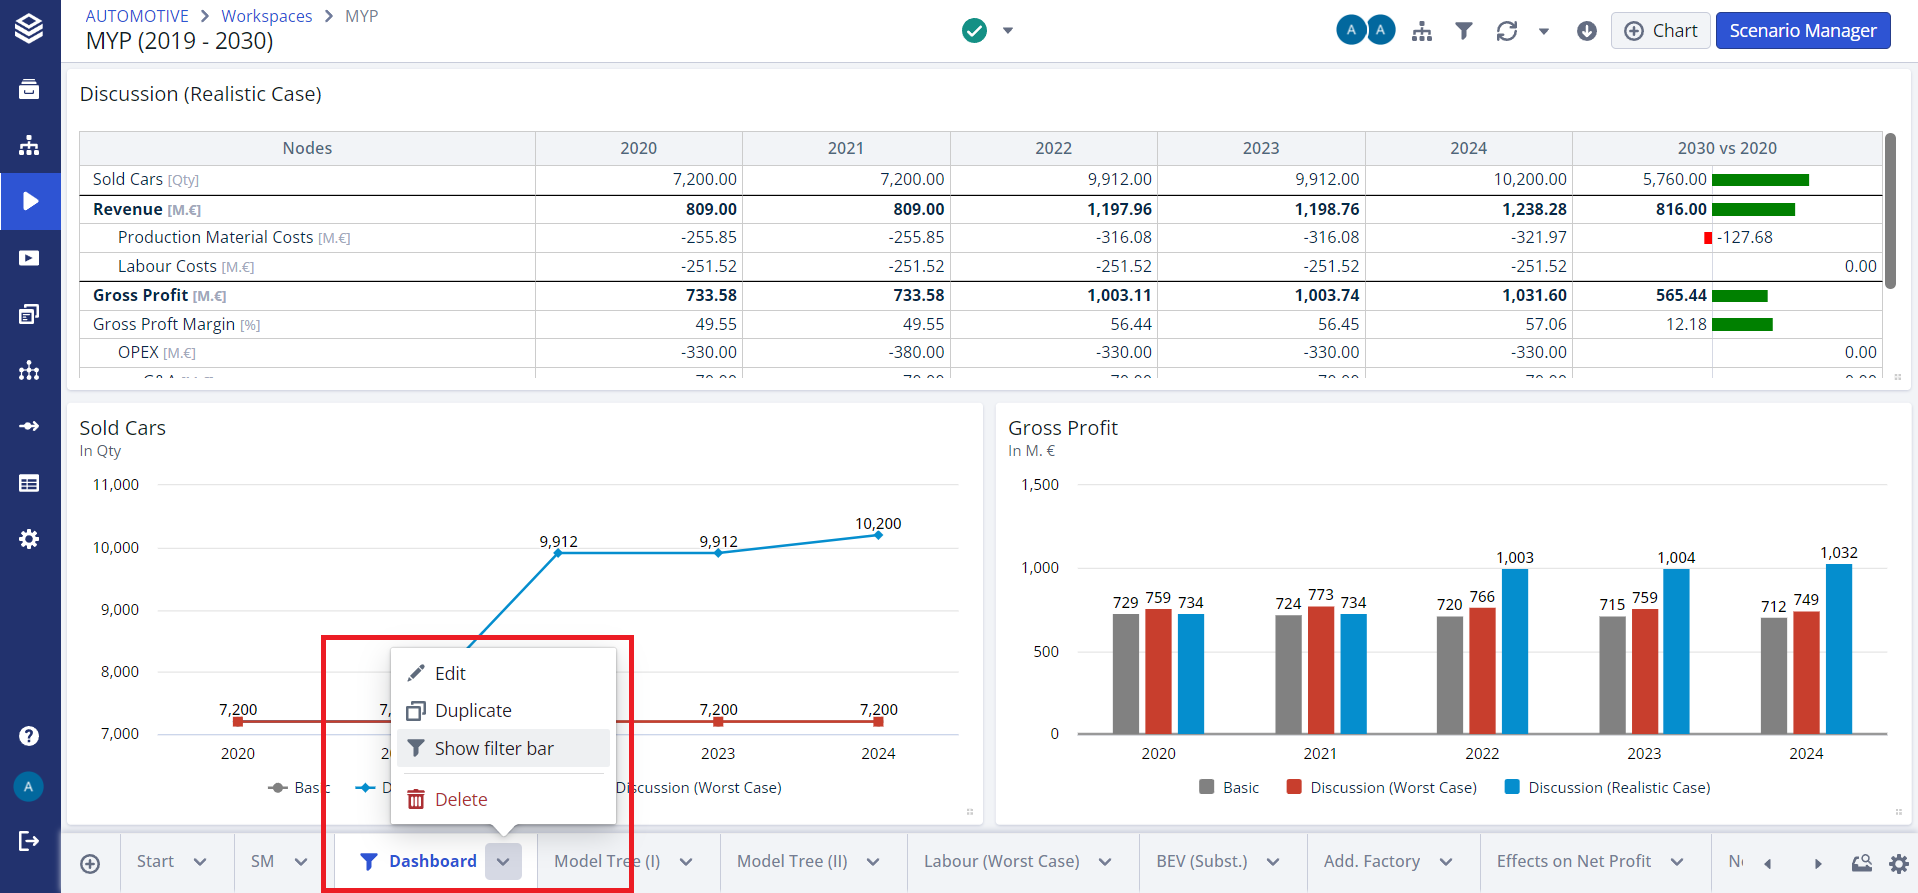
Worksheet filters are limited by the applied workspace filters.
Chart Filter
Chart filters are the third level of filters available in a workspace.
Chart filters can be used to restrict the view in your chart so that they only display a subset of data.
Filters can either be multi-select or single-select filters. Each level that is selected as one of the axes will automatically add a multi-select filter to your chart that contains all values by default.
To limit the number of values on your axis, you can restrict the filter. You can always add a new filter by pressing the "Add Filter" button in the ‘Manage Filters’ dialog and selecting the dimension and level for the new filter.
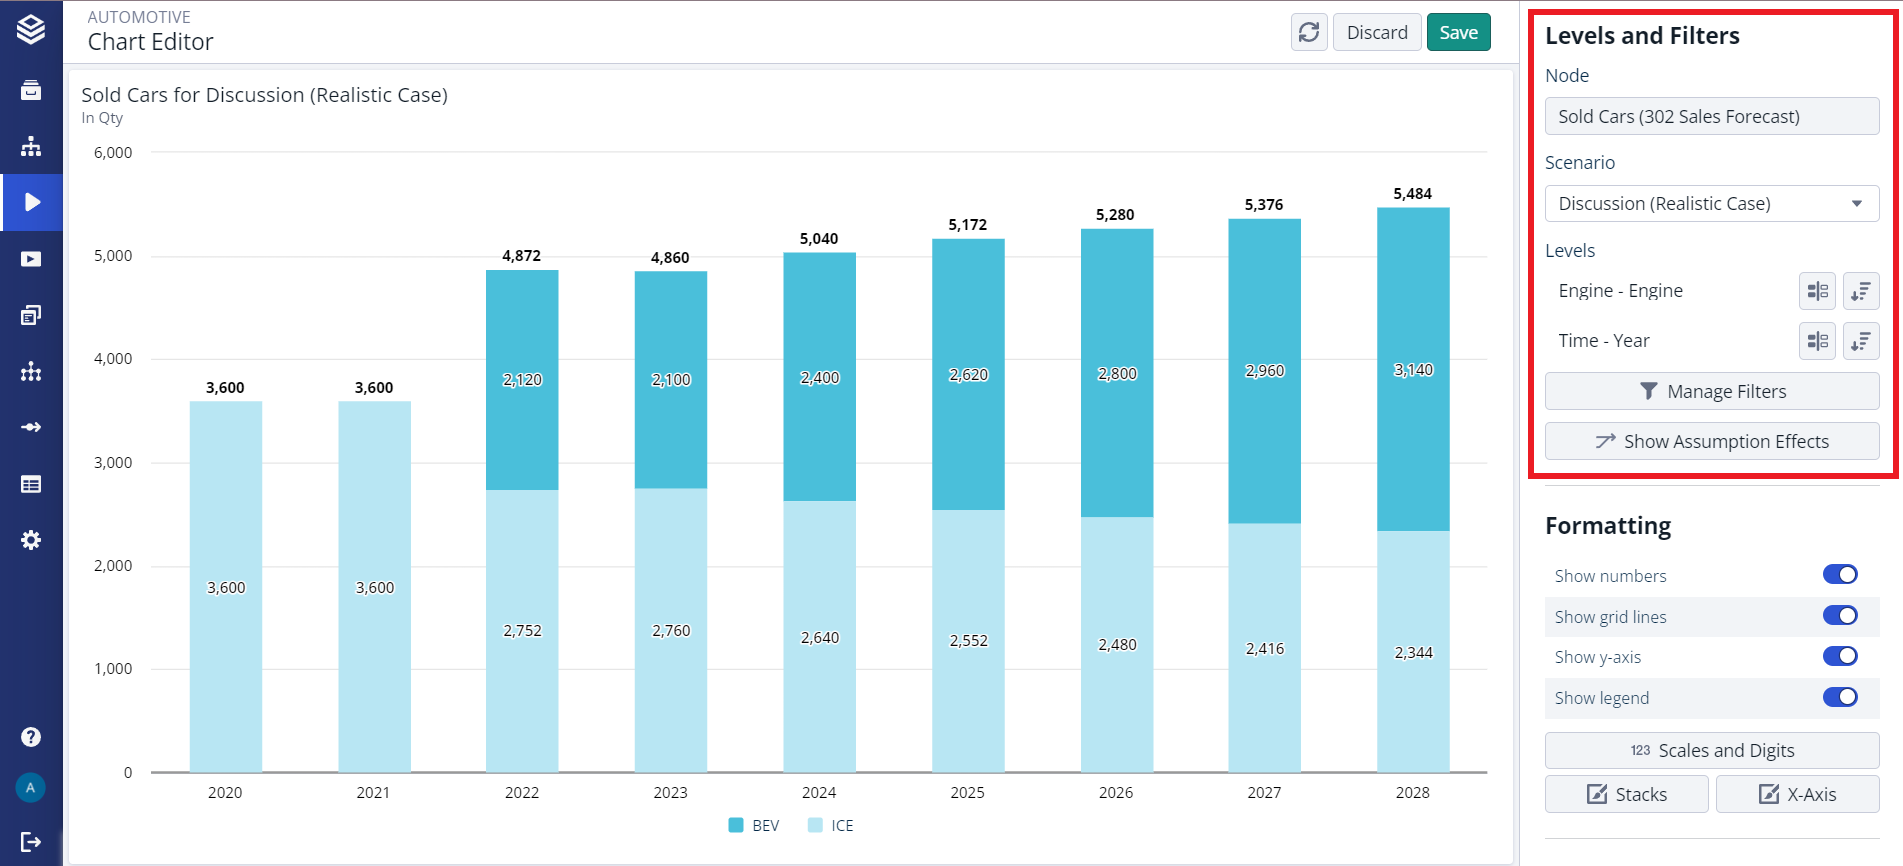
Chart filters are limited by the applied workspace and worksheet filters.
Perspective Selector
Perspective selectors are the fourth level of filters available in Valsight.
Perspectives can be used for a very flexible and less permanent way to filter sheets.
The perspective selector is a separate chart that can be added to a worksheet. For each perspective, multiple multiple filters can be combined to represent that certain perspective.
Each perspective will appear in the perspective selector chart. Combining multiple perspectives to impact a worksheet is possible.
It is also possible to upload a picture for each perspective which will then be shown in the chart.
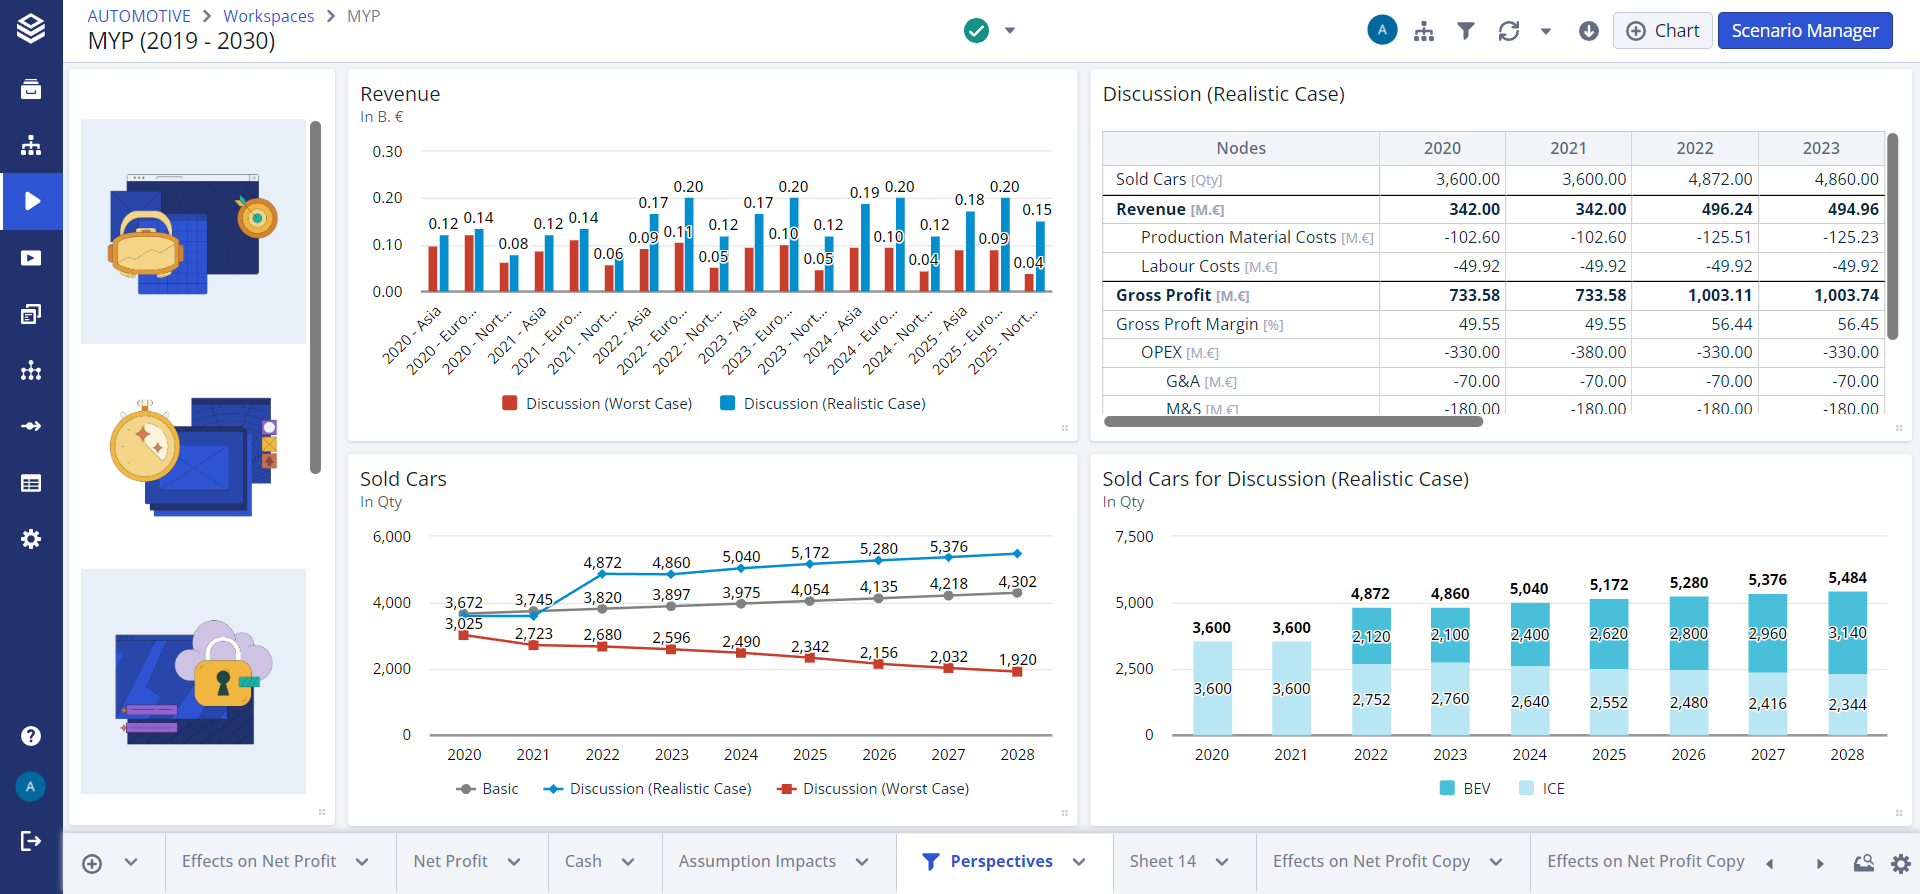
Perspectives are limited by the applied workspace filters, worksheet filters and chart filters.