Data Preview of Nodes
Basic Overview
The data preview is part of the operations/formula editor in a model.
It enables the first overview of the data of a node.
You as a user are able to check the displayed data before for example continuing to work on your model.
Furthermore, the data preview allows continuous cross-checks to validate the effects of functions and calculations.
Functionalities
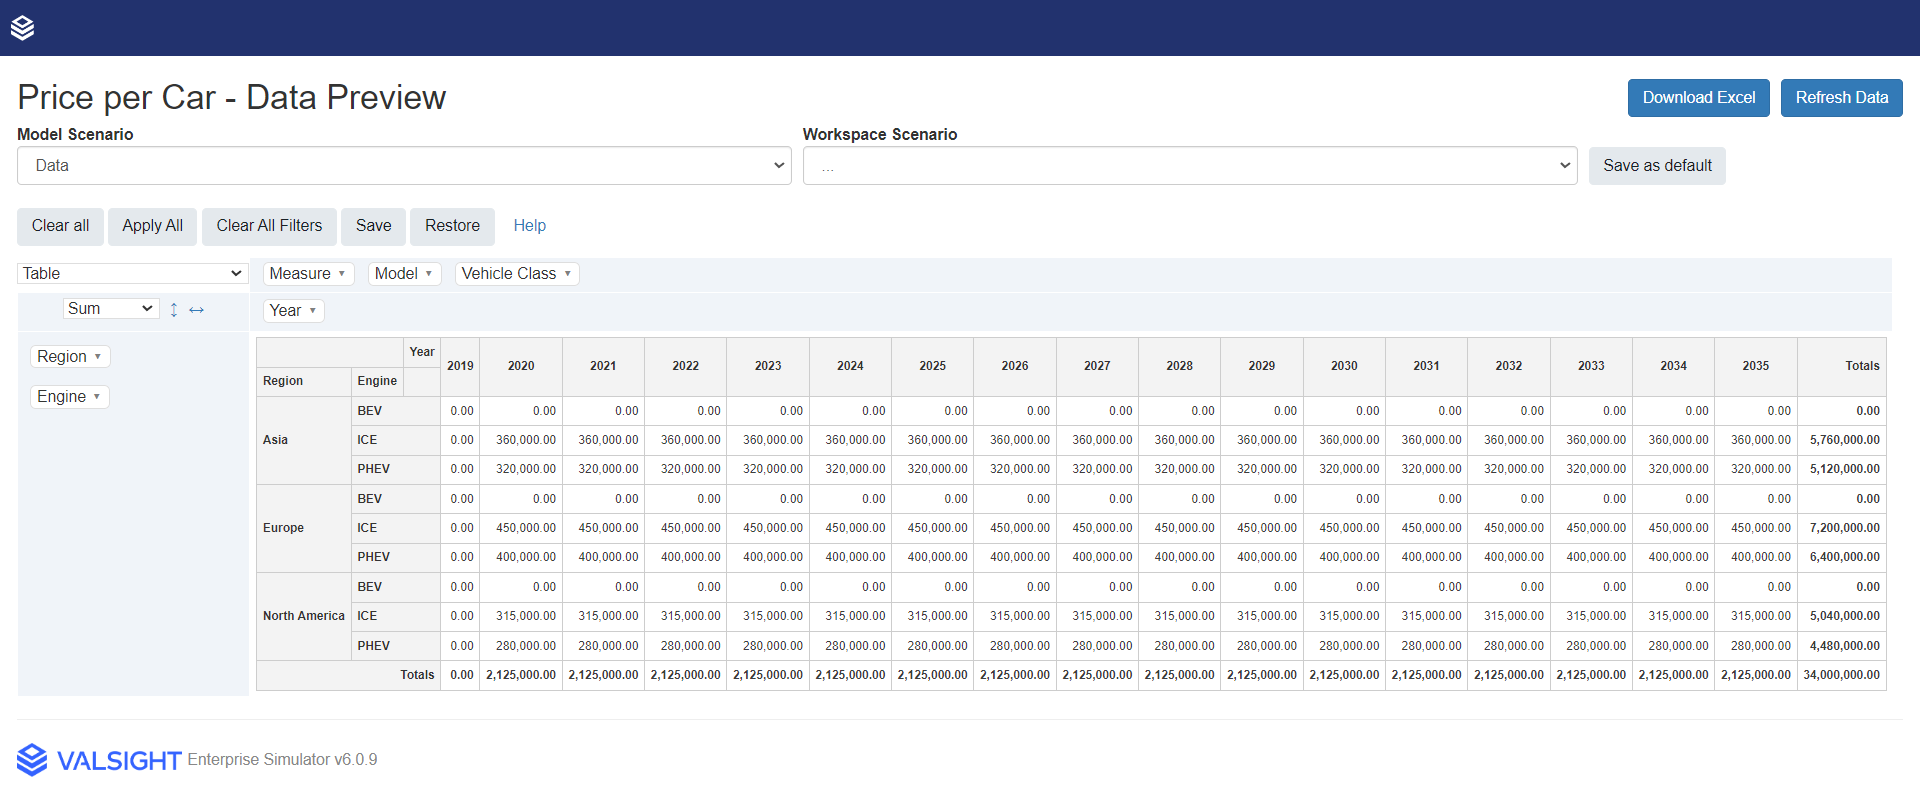
Default Scenario
Setting a scenario as a default scenario enables a standardized view onto your data while switching between data previews of multiple nodes.
This default scenario is saved per user.
Level filter
You can set individual filters for every available level in this table.
By opening the dropdown menu of a level on either of the axes, the user is able to filter out the available level values.
Buttons AVAILABLE SINCE 5.0.4
Clear All | The 'Clear All' - button removes all set level filters and all levels from the axes. This will provide you an aggregated view on the data, based on the selected aggregation type which can be set in the upper left corner of the table. |
Apply All | The 'Apply-All' - button applies all available levels to the axes (time in columns; all other level in rows) and removes all set level filters. That function leads to the most detailed data preview. |
Clear All Filters | The 'Clear All Filters' - button removes all set level filters. |
Save | The 'Save' - button saves all current data preview configurations (levels on axes, level filters,...). These configurations are not only saved for the data preview of this one Node, but for all Models of a Project. This enables you as a user to apply the same filters to multiple Nodes when for example doing drill-downs. |
Restore | The 'Restore' - button restores the last saved data preview configurations and applies them in the selected data preview. This can not only be done in the same data preview, the configurations have been saved in, but in every data preview of the same Project with at least one equal level. In case of Nodes having only 2 overlapping levels, saved configurations only apply to those 2 overlapping levels. |
Additional Project setting for data preview
Valsight provides the administrator of a project with the ability to implement a cell limit for the data preview. In case a data preview exceeds this cell maximum, the data is automatically aggregated to a summed-up total.
That allows a cleaned-up and improved data overview.
The setting can be found under the Valsight settings > Settings under the heading 'Calculations'. Its called "featureFlags.DataPreviewShowsSumsByDefault".
The default maximum cell number is set to 100.000.
Example
To simplify the effect of each button, they will be explained based on an example.
For the following example, an imaginary automobile project is used. The time horizon is 2019-2030.
The model contains the following levels and level values:
Level | Level value | Explanation |
|---|---|---|
Vehicle Class | SUV | |
Sedan | ||
Model | Fast SUV Y | |
Grand SUV X | ||
FamilyFirst Sedan 2 | ||
Fancy Sedan 1 | ||
Engine | BEV | Battery Electric Vehicle |
ICE | Internal Combustion Engine | |
PHEV | Plug-In Hybrid Electric Vehicle |
The context of the example is that the data preview shows the price per car, based on their vehicle class, their model, and their engine over the time horizon.
There is no increase in prices over that horizon.
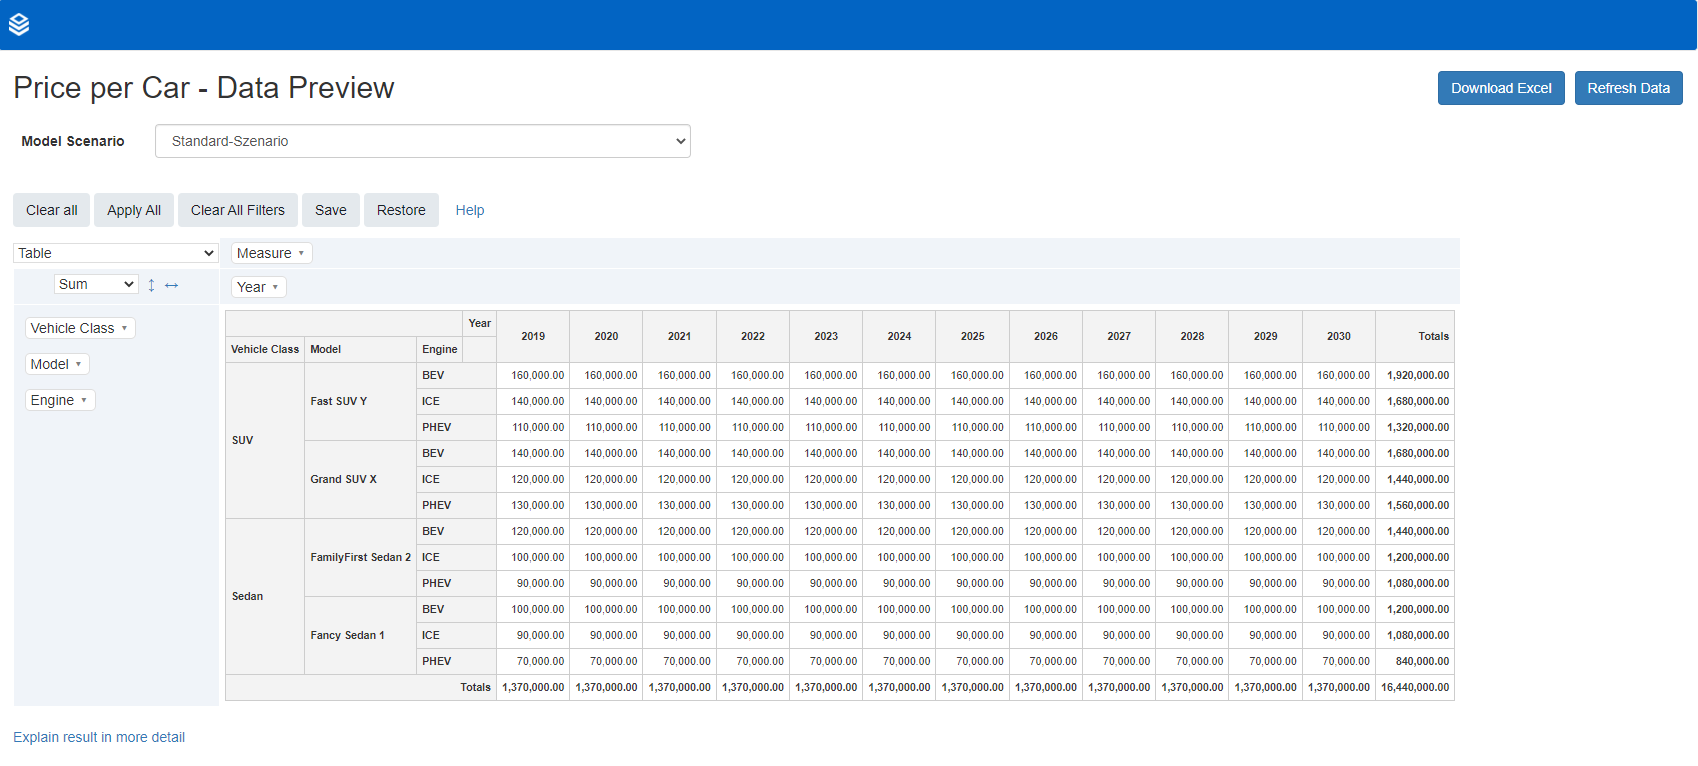
Starting Point
The starting point for the example is the initial data preview, without any filters or aggregations.
Clear All
The 'Clear All' - function aggregates the data, to summed-up totals and reduces the data overview to a minimum amount of data for a better overview.
In this example, the data preview is aggregated to the total costs over the time horizon for both vehicle classes.
This function overwrites level filters and axis configurations.
Apply All
The 'Apply All' - function applies all available levels to the according axes and removes all level filters.
In this example, filters for the 'Vehicle Class' and the 'Engine' have been set. Via the 'Apply All' buttons these filters are reset.
Furthermore, levels have been reconfigured/shifted on the axes. Via the 'Apply All' - function, these configurations are also reset and the available levels are applied to their respective axes.
After using the 'Clear All'- function, the 'Apply All' - function applies all available levels back to their axes.
Clear All Filters
For the 'Clear All Filters' - function, the filters have been set on 'Years' (show 2019, 2020) and 'Engine' (show BEV).
With 'Clear All Filters', those filters are reset back to show all available level values.
Save and Restore
The 'Save' and 'Restore' functions work hand in hand.
In the following example, level filters have been set on the vehicle class (show SUV), the Engine (show BEV), and the Year (show 2021 - 2024).
These configurations have been saved.
After continuing to work on the data preview with several filters, the previously saved configurations have been restored via the 'Restore' - button.
This restoring can not only be done in the same data preview, but for the data preview of all Nodes of the Project.
The 'Save' and 'Restore' functions are user bound. That allows user A to save and restore different data configurations than user B.